Thursday, December 2, 2010

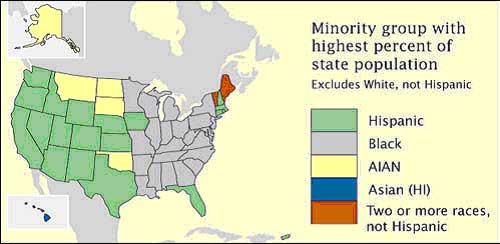
Nominal Area Choropleth Map


A Nominal Area Choropleth Map does not give any particular percentagesof order information. Instead it visually shows us a summary of the data.

Univariate Choropleth Map


A Univariate Choropleth Map is basically a Choropleth Map only discussing on variable.  The example shown above deals with water withdraws in the United States.

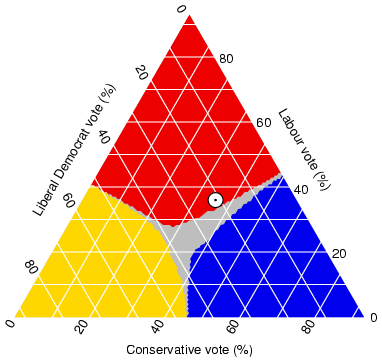
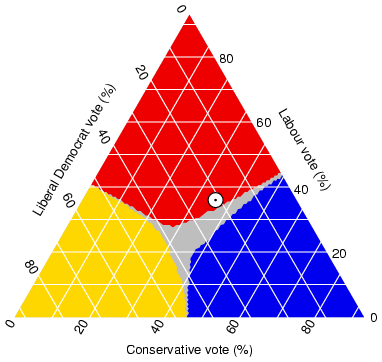
Triangle Plot


A Triangle Plot makes it possible to plot three variables against each other. There is over lap between the variables which forms the gray section in the middle.

Wednesday, December 1, 2010

Bivariate Choropleth Map


A Bivariate Choropleth map is a Classed Choropleth map that compare two sets of statistics. The map above showing the change in divorce rates, comparing a 1980's Classed Choropleth Map to and 1990s Classed Choropleth Map. 

*If you go to the source of the photo the map flashes between Classed Choropleth Maps. I have provided a screencap below in order to show the other map that flashes. 


Unclassed Choropleth Maps


Unclassed Choropleth Maps are extremely similar to Classed Choropleth Maps except, Unclassed Choropleth maps do not have an averaged statistic towards each particular color. There are many shades of each color to show the diversity of the statistics.

Histogram


A Histogram is a basic bar graph that we have been familiar with since early math classes. The example above shows us the statistics of Particular jockeys.

Planimetric Map


Planimetric maps use lines and symbols in order to depict a certain are. They do not include elevation. There primary purpose is for transportation lay outs.